
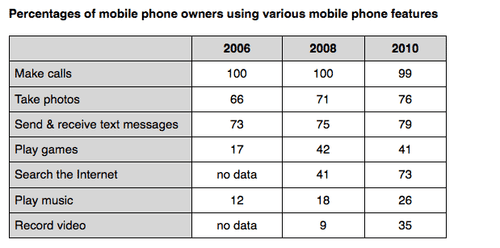
The table illustrates the number of mobile phone owners that used different mobile device features from 2006 to 2010.
Overall
, making calls was the most feature utilized throughout the period, Linking Words
in contrast
, recording videos was the lowest among others.
Starting in the year 2006, making calls achieved the highest percentage rate of 100% use among other applications. Linking Words
This
Linking Words
figures
remains for a two-year period before it went down to 99% in 2010. Change the determiner
figure
However
, even though recording videos and searching the internet had no recorded data in 2006, their numbers rose to 35% and 73% Linking Words
at the end
of the period respectively.
Utilization of taking photos gain a 5% increase every two years, Linking Words
on the other hand
, sending and receiving messages never had more than 5% growth in over 4 years. Playing games number rose sharply from 17% in 2006 to 42% in 2008, before it made a slight decline to 1% by the end of 2010. Linking Words
Lastly
, playing music had a moderate elevation of 6% from 2006-2008 and continue to rise to 26% in 2010.
.Linking Words