
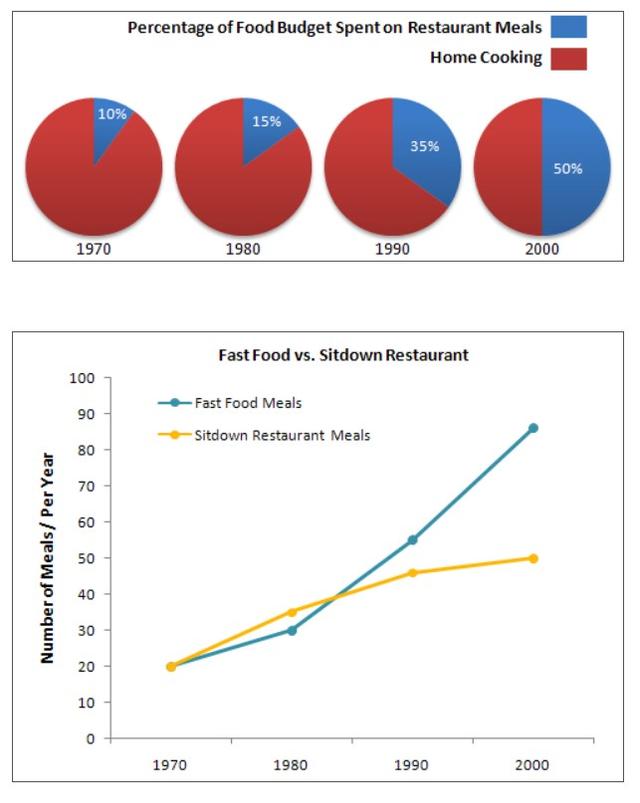
The pie chart below illustrates the
food
Use synonyms
budget
and the average family expenditures on Use synonyms
restaurant
Use synonyms
meals
in various Use synonyms
years
, Use synonyms
while
the graph compares the Linking Words
number
of Use synonyms
meals
eaten in fast Use synonyms
food
restaurants or sit-down restaurants. Use synonyms
Overall
, the percentage of home cooking decreased through the Linking Words
years
to be equal to the percentage of the Use synonyms
food
Use synonyms
budget
spent on Use synonyms
restaurant
Use synonyms
meals
in 2015. Use synonyms
while
Linking Words
,
fast Remove the comma
apply
food
Use synonyms
meals
increased dramatically to 90 overstepping the sit-down Use synonyms
restaurant
Use synonyms
meals
in 2010.
Looking into more details, in 1985, the majority of people relied on home cooking, and only 10% spent their Use synonyms
food
Use synonyms
budget
on Use synonyms
restaurant
Use synonyms
meals
. In 1995, Use synonyms
this
proportion increased slightly to 15%. After 10 Linking Words
years
, the proportion of expenditure on Use synonyms
restaurant
Use synonyms
meals
saw a notable increase, accounting for 35%. More rise was seen in the proportion of Use synonyms
food
Use synonyms
budget
spent on Use synonyms
restaurant
Use synonyms
meals
until it became equal to home cooking.
Now moving to the graph, in 1980, the Use synonyms
number
of fast Use synonyms
food
Use synonyms
meals
and sit-down Use synonyms
restaurant
Use synonyms
meals
was both 20. The former rose slightly to 28 Use synonyms
meals
, Use synonyms
while
the latter increased significantly to 35 Linking Words
meals
in 1990.
Use synonyms
However
, the Linking Words
number
of fast Use synonyms
food
Use synonyms
meals
grew quickly through the Use synonyms
years
until it reached 90 Use synonyms
meals
per year in 2010. Use synonyms
while
Linking Words
,
the Remove the comma
apply
number
of sit-down Use synonyms
restaurant
Use synonyms
meals
kept expanding gradually accounting for 44 Use synonyms
meals
per year in 2010.Use synonyms