
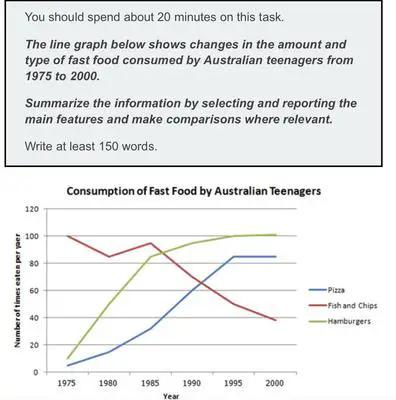
The line graph provided shows the consumption of fast food by Australian Teenagers in the period 1950 until 2010.
Overall
, pizza and hamburgers showed a climbing pattern over the years, Linking Words
however
, Linking Words
fish
and Use synonyms
chips
illustrate a decreasing line.
Hamburgers showed a drastic increase from 1975 till 1985 with changes in utilization from 10 Use synonyms
times
eaten per year by teenagers roses to approximately 85 Use synonyms
times
. Later, the popularity of hamburgers gradually climbed to 100 Use synonyms
times
in 2000. Pizza Use synonyms
also
has the similarity traits where it shows an increase in consumption by youngsters from 5 to 85 Linking Words
times
. On other hand, Use synonyms
fish
and Use synonyms
chips
illustrate a fluctuating pattern which is the opposite trait compared to other fast food. Use synonyms
Fish
and Use synonyms
chips
declined from 100 Use synonyms
times
to around 85 Use synonyms
times
in 1980 and Use synonyms
then
climbed to 95 in the following 5 years. Later on, Linking Words
fish
and Use synonyms
chips
go trough slumped to approximately 40 Use synonyms
times
in 2000.
Use synonyms
Hence
, Linking Words
this
ends the reports.Linking Words