
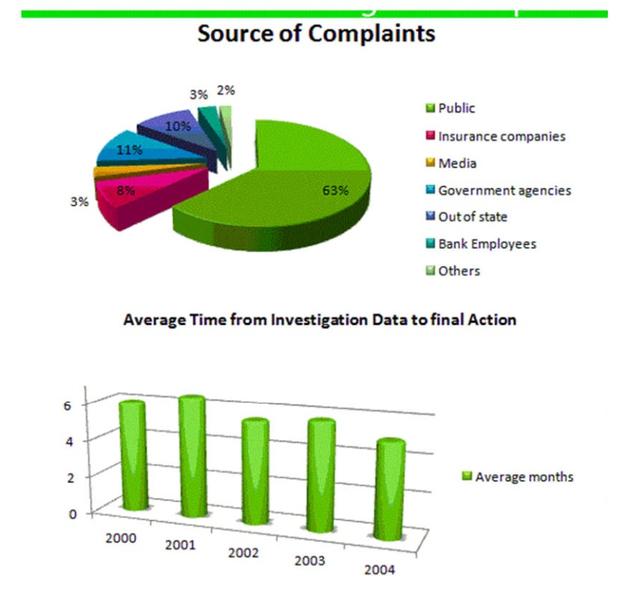
The pie chart illustrates the complaint sources against bank of America is 63%.
the
bank of America and the bar chart shows how much time was taken to solve the Correct article usage
apply
cases
.
Use synonyms
Overall
, the highest percentage of complaints were filed by the public and the lowest Linking Words
cases
were done by others. Use synonyms
Furthermore
, over the period, on average, 4 to 6 Linking Words
months
were needed from investigation to final action.
Use synonyms
Firstly
, the proportion of Linking Words
cases
lodged by the public againstUse synonyms
Add an article
the
a
Then
the number of Linking Words
cases
done by government agencies and out of state is almost equal and the number is 11% and 10% respectively. Use synonyms
Moreover
, 3% of complaints were filed by the media and others. 8% of complaint source is insurance companies.
Linking Words
However
, in 2001, it took about 6 Linking Words
months
for the final action, Use synonyms
while
in 2001, it took the longest time and was exactly 6 Linking Words
months
. After that, it dwindled slightly in 2002 and rose slightly again in 2003. Use synonyms
Finally
, the least period was taken to resolve the Linking Words
cases
Use synonyms
at the end
of the period, which was a little more than 4 Linking Words
months
.Use synonyms