The chart below shows the total number of minutes(in billions) of telephone calls in the UK, divided intot three categories , from 1995-2002 Summarise the information by selecting and reporting the main features, and make comparisons where relevant

The chart below shows the total number of minutes(in billions) of telephone calls in the UK, divided intot three categories , from 1995-2002

Summarise the information by selecting and reporting the main features, and make comparisons where relevant
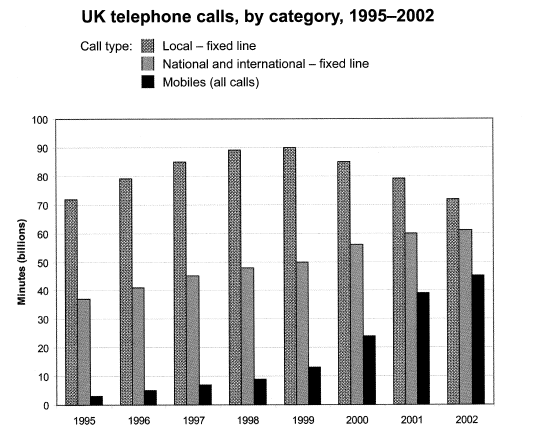
The bar graph illustrates the amount of age spent on telephone calls in minutes in the UK, under three main categories, local, national and international and mobiles over a 7-year period occasion. The number of moments spent on local calls via fixed lines increased continuously from 1995 to 1999 when it peaked and
then
decreased gradually. The number of time spent on mobile calls and national and international calls (fixed line) shows an upward trend from 1995 to 2002. In both years, the number of minutes spent on local calls (fixed line) mobile calls remained the same. In 1995, the time spent on national and international calls was about 35 billion minutes , which is half of the time spent on local fixed-line calls.
Besides
, in 2002 the gap had been reduced significantly.
Submitted by vishvaisuranga on

Unauthorized use and/or duplication of this material without express and written permission from this site’s author and/or owner is strictly prohibited. Excerpts and links may be used, provided that full and clear credit is given to Writing9 with appropriate and specific direction to the original content.

Common mistake: Your writing should be 150-250 words.
Vocabulary: The word "number of" was used 3 times.
What to do next:
Look at other essays: