
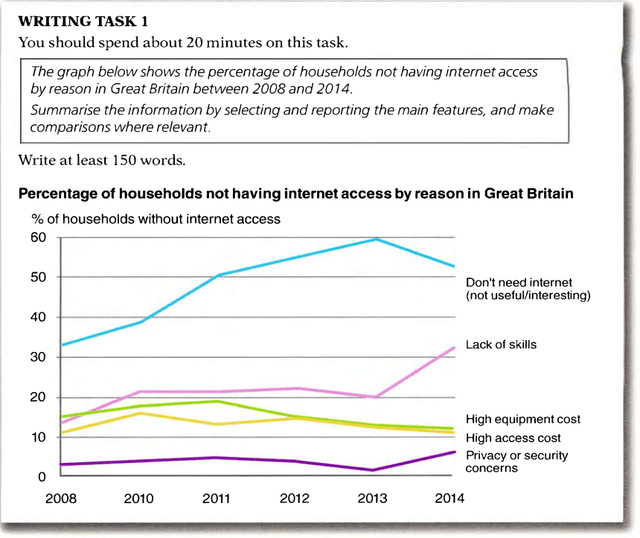
The given line chart illustrates the main reasons why the citizens of Great Britain didn’t have
internet
access from 2008 to 2014.
Use synonyms
Overall
, the proportion of households that don’t need Linking Words
internet
at all and people with a lack of skills witnessed an upward trend, Use synonyms
whereas
the percentage of reasons Linking Words
such
as cost factors and privacy or security concerns fluctuated during the whole Linking Words
period
in question. Another point that should Use synonyms
also
be highlighted is that the reason like the uselessness of the Linking Words
Internet
remained the leading cause of why people didn’t set up the Use synonyms
Internet
, whilst privacy or security concerns Use synonyms
also
were the least cause within the entire Linking Words
period
.
Looking at the details, the proportion of citizens who thought that the Use synonyms
Internet
is not necessary started at more than 30% in the first year, and after reaching a peak of 60% in 2013, the per cent showed a Use synonyms
fall
to about 50% in the final year. As for people with a lack of special skills to use the World Wide Web, the proportion was at approximately 15% in 2008 and during the first 5 years was stable at about 20%, following which there was a significant rise to more than 30% in 2014.
Meanwhile, the percentages of households that don’t use the Replace the word
fell
Internet
Use synonyms
due to
high equipment and access costs fluctuated between 15% and 20% over the whole Linking Words
period
in question. The same can be true about households which didn’t apply the Use synonyms
Internet
because of privacy or security concerns, the figure showed fluctuations between 1% and 10% to the end of the Use synonyms
period
.Use synonyms