
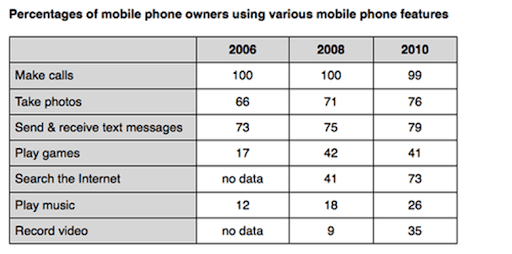
The table graph illustrates the per cent of mobile phone users who use different types of features during the three years.
Overall
, it can be seen that the majority of the public used mobile for making calls in 2006, 2008 and 2010.Linking Words
However
, the least number of individuals use to play music service way cell phones.
Linking Words
To begin
,with making call features, 100% of people used these in 2006 and 2008. Just a 1 per cent decline was noticed in 2010. Taking photos and sending and receiving text messages were the second most used features by people which ranged between 66% to 79%.In 2006 only 17% of people used cell phones to play games which increased dramatically by above two-fifths in the following years.
With regard to, play music feature used by 12% in 2006.Linking Words
This
figure increased slightly by 18% in 2008.Surprisingly Linking Words
this
figure jumped to 26% in 2010. Search the internet and recording video service data were not available in 2006 but these figures dramatically increased from 41% to 73% and 9% to 35% in the years 2008 and 2010 respectively.Linking Words