
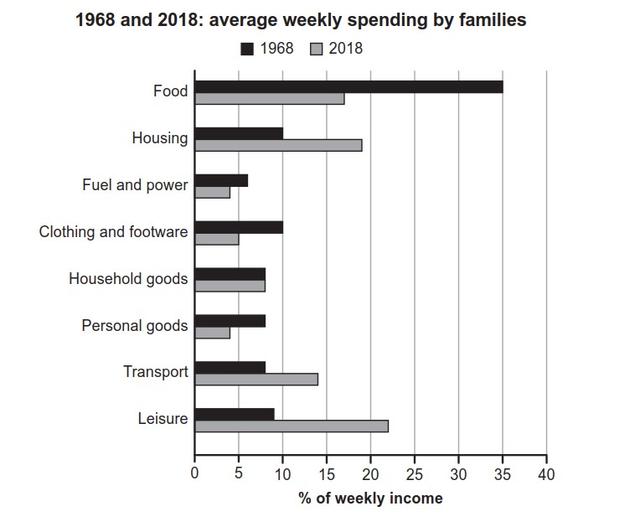
The provided graph has shown the weekly payment of families on different objects.
This
chart covers a span between 1968 and 2018. as per Linking Words
this
chart , there are 8 different Linking Words
expenditure
as food , housing , household goods , personal goods , transport , Fix the agreement mistake
expenditures
leisure
, Use synonyms
fuel
and Use synonyms
power
, clothing and Use synonyms
footware
.
Correct your spelling
footwear
Overall
, after an analysis of Linking Words
this
line graph, it can be observed that food was the highest Linking Words
percentages
, Fix the agreement mistake
percentage
whereas
Linking Words
fuel
and Use synonyms
power
were the lowest percentages in 1968. In 2018, personal goods Use synonyms
was
the least Change the verb form
were
proportions
Fix the agreement mistake
proportion
in contrast
to Linking Words
leisure
which was the most percentage.
In the beginning, housing , clothing and Use synonyms
footware
were similar (10%). Correct your spelling
footwear
In addition
, transport and Linking Words
leisure
were nearly the same hit (8.5%) , (7.8%) Use synonyms
consequently
in 1968 . Linking Words
However
, food , Linking Words
fuel
and Use synonyms
power
were completely different registered (35%),(6%) in order.
Later on, Use synonyms
leisure
and housing are nearer and it recorded around (23%),(19%) Use synonyms
subsequently
. Linking Words
Moreover
, Linking Words
leisure
Use synonyms
were
the highest percentage (23%) Change the verb form
was
in contrast
to Linking Words
fuel
and Use synonyms
power
were scored approximately (3%) in 2018.Use synonyms