
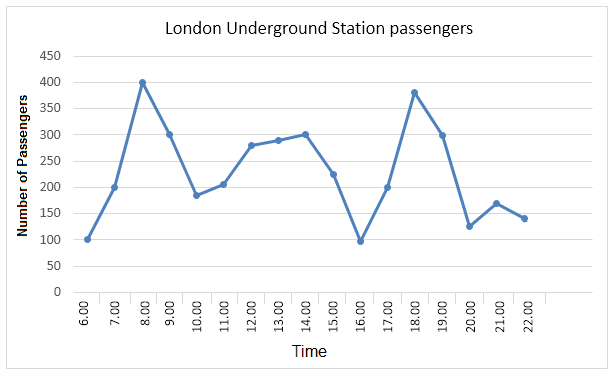
The graph provides data relating to the number of passengers at the Underground Station in London.
Initially
, at 6:00 am it is 100 passengers, Linking Words
however
, over the course of 2 hours, the number quartered, attaining a peak of 400 at 8:00 am. After, the line depicts a plunge to 200 at 10:00 am, followed by a spike till 300 at 12:00 am. Linking Words
Then
, the numbers uniformally increase till 300 at 14:00 pm, before hitting a trough at 16:00 pm, which is equvalent to the number on the start. But at 18:00 pm the line displays attaining second highest point(roughly 380) and, again, a drastic tail off at 20:00 pm to approximately 130. Linking Words
Finally
, at 20:00 pm, after slight climb in numbers, at 22:00 pm it drops to similar level in 20:00 pm.
In summary, the rush hours in London Underground Station are in 8:00 am and 18:00 pm, Linking Words
whereas
the lowest numbers are showed at 6:00 am and 16:00 pm.Linking Words