
This
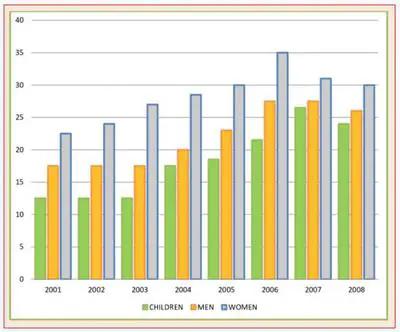
bar chart illustrates data about the proportion of women, men and children who were consuming five types of fruits and vegetables every day in the United Kingdom since the year of 2001 to 2008.
Linking Words
Overall
, women experienced the highest percentage of eating fruits and vegetables Linking Words
while
youngsters had the lowest. Linking Words
Also
, there are some notable changes in the consumption of Linking Words
this
meal.
Linking Words
Firstly
women's per Linking Words
cent
started at just over 20% in 2001. Use synonyms
Then
Linking Words
this
number rose significantly in 2006 when it reached its peak of 35 per Linking Words
cent
. Use synonyms
However
, it did not Linking Words
last
for long and in 2008 it dropped to 30 per Linking Words
cent
.
When it comes to men and offspring Use synonyms
it is clear that
the rate remained relatively the same in the first three years, with 17 per Linking Words
cent
for the former and 13 per Use synonyms
cent
for the latter. Use synonyms
Then
men's consumption rose gradually to a peak of 28 per Linking Words
cent
in 2006 and 2007. Children experienced an upward trend in 2007 with 27 per Use synonyms
cent
but it dropped in the Use synonyms
last
year to 24 per Linking Words
cent
.Use synonyms