
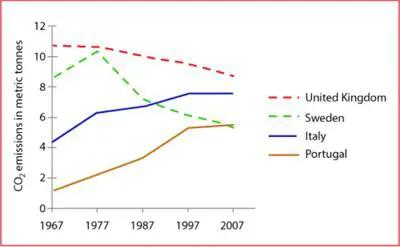
The above line graph indicates the number of gas emissions, specifically carbon dioxide from 1976 until 2007 in four different developed countries. In general, throughout 31 years of monitoring, production of emission in Portugal and Italy were rising.
In contrast
, Linking Words
Sweden
and Use synonyms
the
UK's contributions were decreasing.
Correct article usage
apply
Overall
, if week looks at the very first result of monitoring, which is in 1976, Portugal was the winner among the other four countries by becoming the least contributor of carbon dioxide. Portugal only had 2 metric Linking Words
tonnes
and followed by Italy with less than 6 metric Use synonyms
tonnes
. The United Kingdom and Use synonyms
Sweden
are the top two among the other two with more than 8 metric Use synonyms
tonnes
. Over the next 20 years, an unprecedented situation happened for the amount of gas monitored in the UK and Use synonyms
Sweden
. Both countries showed they are able to decline the number to approximately 2 metric Use synonyms
tonnes
. Use synonyms
On the other hand
, worse conditions happened in Portugal and Italy.
Looking at the data provided, Portugal and Italy had similar conditions from 1967 to 2007 where emissions were rising by almost 2 metric Linking Words
tonnes
. Use synonyms
However
, Linking Words
Sweden
and the UK showed ,unlike circumstances with a shrinking quantity of carbon dioxide.Use synonyms