
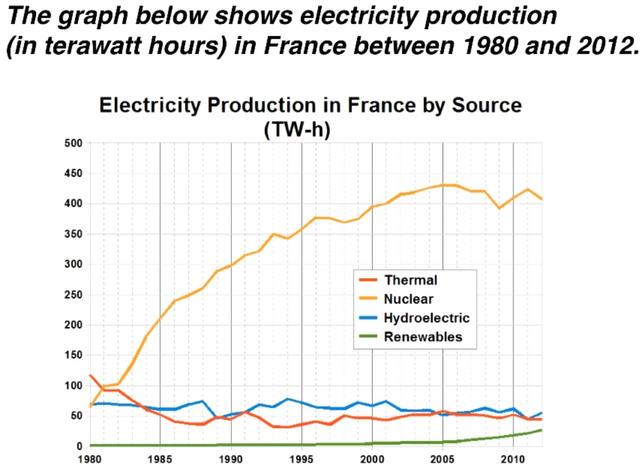
The line graph provides a comparison among 4 categories in terms of the sources of
energy
produced in France over a period of 3 decades.
Use synonyms
Overall
, the main feature of the data is that nuclear Linking Words
power
stations had demonstrated the primary form of electricity over that duration, Use synonyms
however
, using renewables as a Linking Words
power
source amounted to a negligible number.
Use synonyms
Initially
, it is evident that in 1980 thermal Linking Words
energy
provided the most important means of electricity amounting to over 100 (TW-h), Use synonyms
while
nuclear and hydroelectric Linking Words
power
started at roughly the same point which is almost 55 (TW per hour). Use synonyms
In addition
, between the period 1980 to 2000 renewables source of Linking Words
energy
was showing stability.
By 1980 nuclear Use synonyms
energy
overtook thermal Use synonyms
power
with a sharp increase reaching a peak in 2005 amounting to just below 450 (TW-h). Use synonyms
In contrast
, thermal Linking Words
energy
saw a dramatic drop in 1980. It can be clearly seen that over that term hydroelectric Use synonyms
power
remained fluctuating ,Use synonyms
,
Change the punctuation
apply
Linking Words
however
renewables started to soar slightly in the 2000s.Add a comma
,however