
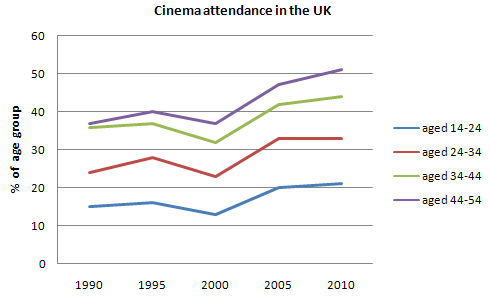
the line chart below compares the percentage of
people
from four different age groups in a particular country from 1990 to 2010.
Use synonyms
Overall
, the folks between 44 and 54 by far were the main source of cinema attendance in the UK, Linking Words
while
the Linking Words
people
aged 14-24 showed the least interest in the film. Use synonyms
Additionally
, the total trend of the number of citizens who entered the cinema was upward.
Linking Words
It is clear that
the four different age groups saw a slight rise in the first five years, the figure for the Linking Words
people
aged between 44 and 54 reached 40%, followed by those from 34-44 at 38%, 24-34 at 28%, and 14-24 at 16%. Use synonyms
However
, in the sequent five years, they all dropped by within 5%. Between 2000 and 2010, there was a remarkedly growth in the number of citizens attending the cinema from 38% in 2000 to more one half 10 2010.
Linking Words
Apart from
Linking Words
this
, the proportion of Linking Words
people
from 14-34 nearly levelled off in the Use synonyms
last
five years at 21% and 32% respectively. As for those between 34-44, it Linking Words
finally
arrived at 44%.Linking Words