
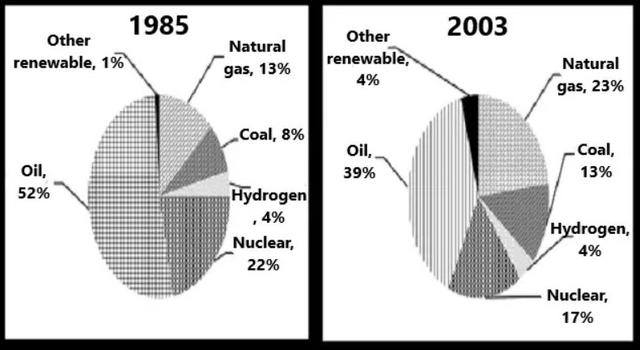
The given pie charts provide information about the
energy
produced by a country using 6 difficult sources from 1985 to 2003.
In general, the main source from which the Use synonyms
energy
was produced was oil with Use synonyms
52
% contribution in 1985. Correct article usage
a 52
Likewise
, in 2003 oil contributed 39% Linking Words
in
Change preposition
of
energy
production. But compared to 1985 the Use synonyms
reliability
of natural gas to manufacture Use synonyms
energy
increased from 1% to 4% and 8% to 13% respectively.
Use synonyms
On the other hand
, Linking Words
Use synonyms
reliability
to manufacture Correct article usage
the reliability
energy
on nuclear was 22% in 1985 which Use synonyms
reduced
to 17% by 2003. Add a missing verb
was reduced
While
the Linking Words
reliability
Use synonyms
on
most of the resources fluctuated, the Change preposition
of
reliability
Use synonyms
on
hydrogen remained constantChange preposition
of
4
%. Change preposition
at 4
Overall
from 1985 to 2003 oil stayed the main source of Linking Words
energy
production and other renewable resources remained the least.Use synonyms