
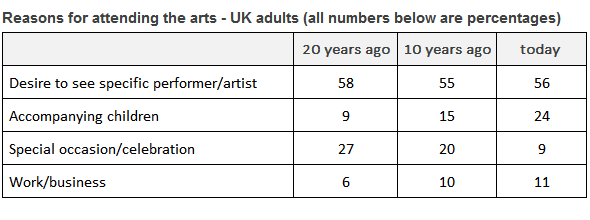
The provided table illustrates the percentage of the number of attendees to arts events in 20
years
in the UK.
Use synonyms
Overall
, it can be clearly seen from the table that, the Linking Words
people
who attended just to see their favourite artist have the highest per cent in all periods, Use synonyms
while
those who went for business have the lowest number.
Linking Words
To begin
with, those who went to see a performer 20 Linking Words
years
were 58%, Use synonyms
then
10 Linking Words
years
ago 55%, but today they are 56%. Use synonyms
Secondly
, regarding the Linking Words
people
accompanying their children, it’s clear to see that 20 Use synonyms
years
ago just was 9%, 10 Use synonyms
years
ago, 15% but today they are risen to reach 24%. Use synonyms
Moreover
, there were 27% of Linking Words
people
attended because had a special occasion for 20 Use synonyms
years
, and the next year after year the percentage decreased to 9% nowadays. In the Use synonyms
,
end we have some Remove the comma
apply
people
attending arts events for work, the number increased Use synonyms
according to
the data, 6% in the past and 11% in the Linking Words
last
.Linking Words