
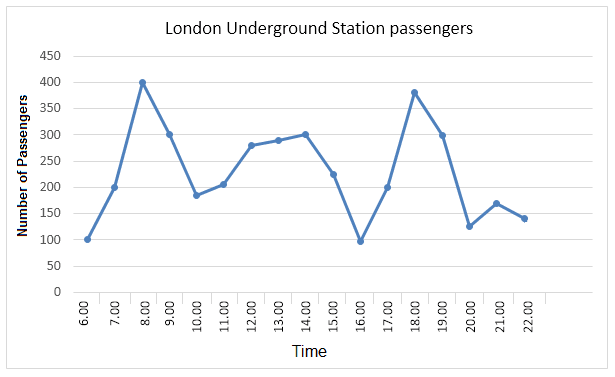
This
line graph illustrates the Linking Words
number
of passengers on London's Underground Station from 6 to 10 o'Use synonyms
clock
.
Use synonyms
Overall
, there were massive fluctuations, but the Linking Words
number
of Use synonyms
people
in the subway was increasing throughout the day. The highest Use synonyms
number
of Use synonyms
people
was at 8 Use synonyms
hours
.
At 6 Use synonyms
hours
there were 100 Use synonyms
people
in the underground, Use synonyms
then
it dramatically increased to 400 Linking Words
people
at 8 Use synonyms
hours
before the Use synonyms
number
decreased to just under 200 at 10 Use synonyms
hours
in the morning. Use synonyms
Then
it steadily rose to just under 300 Linking Words
people
, but Use synonyms
then
to 300 Linking Words
people
at 14 Use synonyms
hours
.
From 14 to 16 Use synonyms
hours
, there was a significant fall from 300 to 100 Use synonyms
people
. Use synonyms
Then
it increased massively, at first to 200 Linking Words
people
at 17 o'Use synonyms
clock
and Use synonyms
then
to around 360 at 18 o'Linking Words
clock
. After that, the Use synonyms
number
of Use synonyms
people
dropped to approximately 150 at 20 o'Use synonyms
clock
Use synonyms
,
but Remove the comma
apply
then
increased to around 200 Linking Words
people
.Use synonyms