
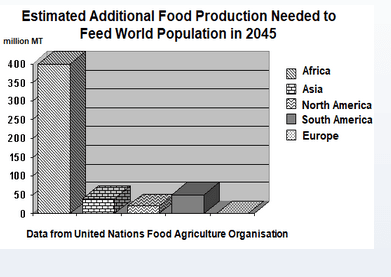
The bar graph illustrates the increase in
production
of Correct article usage
the production
food
in Africa, Asia, North Use synonyms
America
, South Use synonyms
America
and Europe which is measured in Use synonyms
million
Use synonyms
metric
Change preposition
of metric
Use synonyms
ton’s
to cater Change noun form
tons
the
hunger needs of the population in 2045. The data is collected from the United Nations Change preposition
for the
Food
Agricultural Organisation.
It is observed that the chart depicts that the average Use synonyms
food
production in Africa is 400 Use synonyms
million
metric Use synonyms
ton’s
which is comparatively the highest compared to that of the other continents. Use synonyms
On the contrary
, Europe produces the least.
Linking Words
Likewise
, South Linking Words
America
produces 50 Use synonyms
million
metric Use synonyms
Use synonyms
ton’s
by 2045. Change the noun form
tons
ton
Whereas
Asia Linking Words
on the other hand
produces about 40 Linking Words
million
metric Use synonyms
ton’s
which is relatively low compared to that of
South Use synonyms
America
. Use synonyms
However
, North Linking Words
America
produces almost about 25% which is more than that Use synonyms
of
Europe.
Change preposition
apply
Overall
, Africa produces seven times more than South Linking Words
America
as per the data collected by the United Nations Use synonyms
Food
Agriculture Organisation which invariably depicts the increase in population by 2045.Use synonyms