The bar chart below describes some changes about the percentage of people were born in Australia and who were born outside Australia living in urban, rural and town between 1995 and 2010. Summarise the information by selecting and reporting the main features and make comparisons where relevant. You should write at least 150 words.

The bar chart below describes some changes about the percentage of people were born in Australia and who were born outside Australia living in urban, rural and town between 1995 and 2010.

Summarise the information by selecting and reporting the main features and make comparisons where relevant.

You should write at least 150 words.
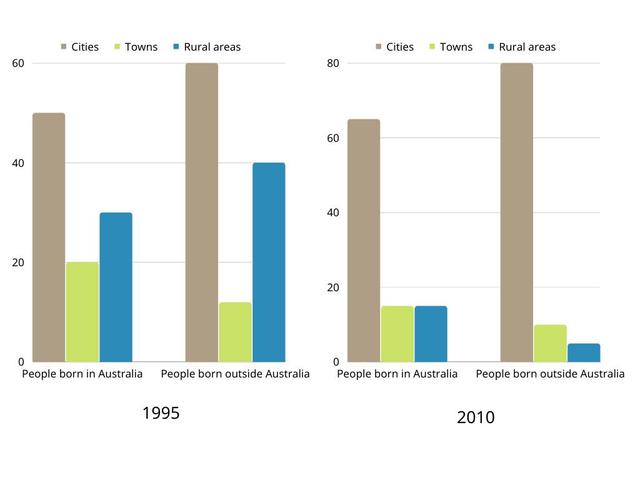
The bar charts compare the proportion of
people
living in three types of regions, namely cities, towns and rural
areas
, in 1995 and 2010. It gives more detail by
further
classifying
people
into those born in
Australia
and those born outside
Australia
as well.
It is clear that
after 15 years, the percentages of both types of the population living in cities increased,
while
there were far fewer residents who chose to live in rural
areas
. In 1995, approximately 50% of Australian-born
people
and 60% of
people
born outside
Australia
lived in cities.
However
, about 30 % and 40 % of
people
still chose rural
areas
as their residential locations. The figures for those living in towns were 20% and 10% respectively. 2010 saw an apparent rise in the ratio of urban residents, with an increase of around 15 % for those born in
Australia
and 20 % for those born outside
Australia
.
By contrast
, the figure for those living in rural
areas
dropped sharply to just more or less than 10%. The proportion of
people
living in towns
also
declined slightly.
Submitted by xiexue1223 on

Unauthorized use and/or duplication of this material without express and written permission from this site’s author and/or owner is strictly prohibited. Excerpts and links may be used, provided that full and clear credit is given to Writing9 with appropriate and specific direction to the original content.

Sentences: Add more complex sentences.
Vocabulary: Replace the words people, areas, australia with synonyms.
Vocabulary: The word "figures" was used 2 times.
Vocabulary: The word "proportion" was used 2 times.
Vocabulary: The word "increased" was used 2 times.
Topic Vocabulary:
  • Percentage
  • Demographic
  • Trends
  • Urban areas
  • Rural areas
  • Town
  • Native-born
  • Foreign-born
  • Migration patterns
  • Economic factors
  • Government policies
  • Increase
  • Decrease
  • Steady
  • Peak
  • Trough
  • Time frame
  • Significant changes
  • Distribution
  • Notable
What to do next:
Look at other essays: