
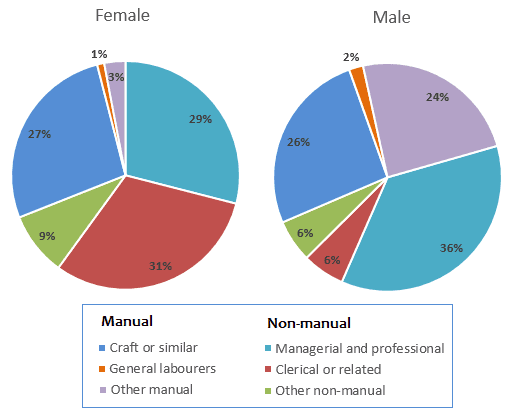
The pie charts illustrate information about the patterns of some careers of both males and females in Great Britain in 1992.
Overall
, it can be seen that the total of non-manual Linking Words
employment
; manager and professional, clerical or related and other types had a major proportion of female careers, Use synonyms
while
the sum of the percentage of manual and non-manual Linking Words
employment
in males had the slightly same proportion.
For female non-manual career information, both Use synonyms
clerical
or related Correct article usage
the clerical
group
and the managerial and professional Use synonyms
group
had over half at 60% and were at 31% and 29% respectively, meanwhile the total of manual Use synonyms
employment
; craft or similar, general labourers and Use synonyms
other
were just 31%
Turning to male Correct pronoun usage
others
employment
information, the biggest number of careers was managerial and professional in the non-manual Use synonyms
group
at 36%. Another manual was 24% Use synonyms
at
the second biggest proportion and third was craft or similar career of the manual Change preposition
apply
group
at 26% Use synonyms
while
other manual Linking Words
employment
, clerical or related Use synonyms
group
career and general labourers were the small part at 6%, 6% and just only 2% respectively.Use synonyms