
This
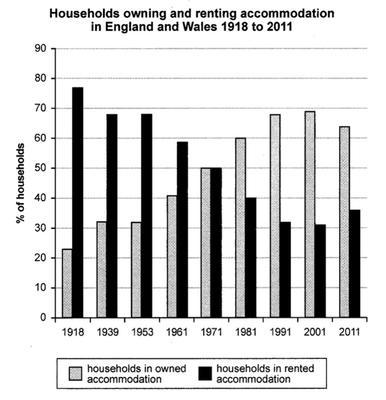
bar graph illustrates the percentages of rented and owned households in England and Wales that were evaluated from 1918 to 2011. The time series does not include all years in that period, Linking Words
instead
shows only nine of them, which each gap being approximately 10-20 years.
In general, the number of rental and individual houses was changing constantly throughout Linking Words
this
period. On one side, people who bought residences significantly increased by around three times from the first observed year. It rose from less than 25% in 1981 to more than 65% in 2011. Linking Words
On the other hand
, regularly paid households were repeatedly depleted. It shrank nearly half from the start.
If we looked properly from 1953 to 1991, both events had the exact opposite pattern. It demonstrated not only the continually increasing or decreasing proportions of the two types of housing but Linking Words
also
the same ratio in each dropped and rose, which was as much as 10%. Linking Words
Moreover
, the year 2001 was the anomaly pattern in either subject. It fell not far from 5% for purchased households, Linking Words
whereas
it rose to almost 8% for the others. In conclusion, people in England and Wales preferred to buy houses rather than keep renting.Linking Words