
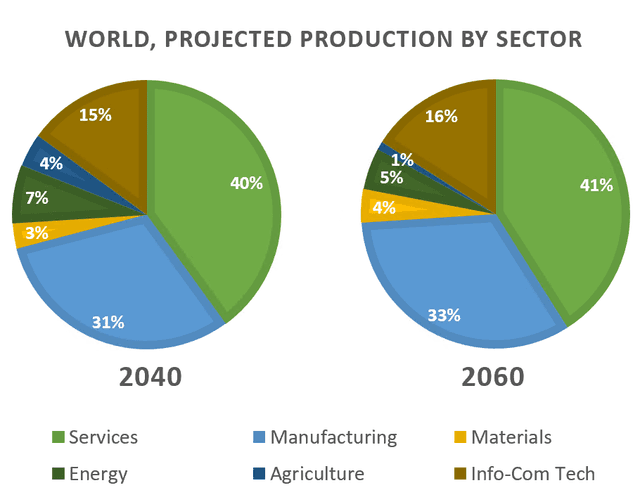
The given pie charts represent the projections for 6 types of world production in two sectors which are 2040 and 2060.
Overall
,it can be clearly observed that services are the highest proportion in both years. Interestingly, it has a minor change which is an increase of 1%, Linking Words
while
Info-com Tech and Materials have the same pattern. It is Linking Words
also
interesting to note that Manufacturing is risen by 2%.
Linking Words
According to
the graphs , there major alter in Energy and Agriculture which were dropped down 2% and 3% respectively.
Linking Words
Finally
, Linking Words
it is clear that
services,Info-com Tech, Manufacturing and Materials experienced upward. trend , Linking Words
whereas
Energy and Agriculture displayed a downward trend.Linking Words