
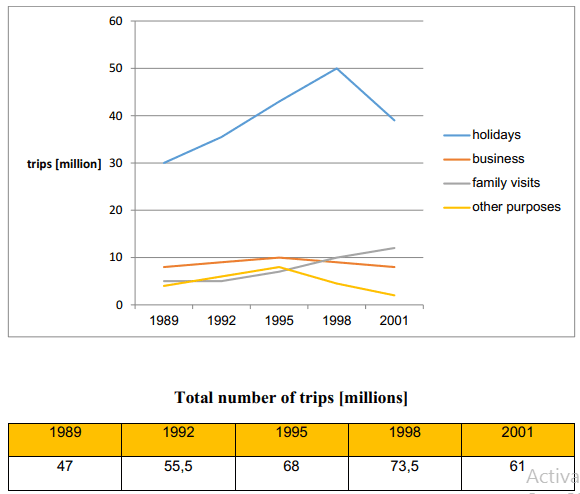
The graph illustrates the figure for overseas trips experienced by British people for a variety of reasons from 1989 to 2001.
Overall
, the most popular purpose for travelling abroad was to go on holiday in the period given, that was about 30 Linking Words
million
Use synonyms
times
in 1989 and gradually increased until approximately 50 Use synonyms
million
Use synonyms
times
in 1998, after which it decreased to under 40 Use synonyms
million
Use synonyms
times
in 2001.
In the first year, travelling for business was done below 10 Use synonyms
million
Use synonyms
times
and remained constant during the period. Use synonyms
On the other hand
, family visits and other purposes were about 5 Linking Words
million
Use synonyms
times
in 1989 respectively, resulting in more than double the number of family visits, Use synonyms
whereas
other purposes dropped to the point of a third Linking Words
at the end
.
Looking into the total number, it started from the lowest figure in the first year which was 47 Linking Words
million
overseas trips and steadily increased reaching the highest number of 73.5 Use synonyms
million
in 1998, after which it fell to 61 Use synonyms
million
trips.Use synonyms