
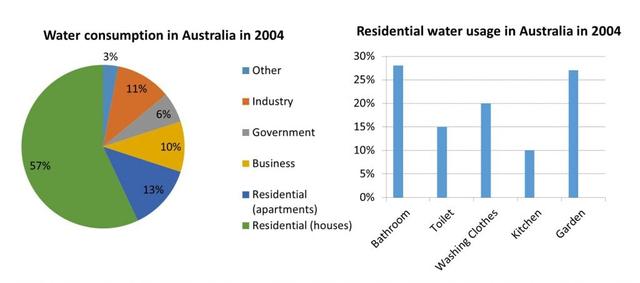
the pie chart illustrates the proportion of
water
consumption in different areas in Australia in the year 2004, Use synonyms
whereas
the bar graph compares the Linking Words
purposes
of residential Use synonyms
water
usage.
Use synonyms
overall
, a significant amount of Linking Words
water
was utilised for residential Use synonyms
purposes
, Use synonyms
while
other categories were relatively similar in the surveyed year. remarkably, the consumption of Linking Words
water
in the bathroom and garden is recorded to head the list in terms of residential Use synonyms
water
use.
looking in detail, the percentage of Use synonyms
water
usage in residential areas accounted for 70%, followed by the figure for industrial and business Use synonyms
purposes
, taking up 11% and 10%, respectively. the category of government's Use synonyms
water
usage reached 6%, which was 2 times higher than that of "others" in the given year.
regarding the bar graph, the proportion of Use synonyms
water
utilization in the garden hit its peak of 28%, Use synonyms
while
only 10% of Linking Words
water
was used in the kitchen. Use synonyms
moreover
, Linking Words
this
figure for washing clothes was 20% in comparison with 15% of that in the toilet. residents used over a quarter of the total Linking Words
water
for Use synonyms
purposes
in the bathroom.Use synonyms