
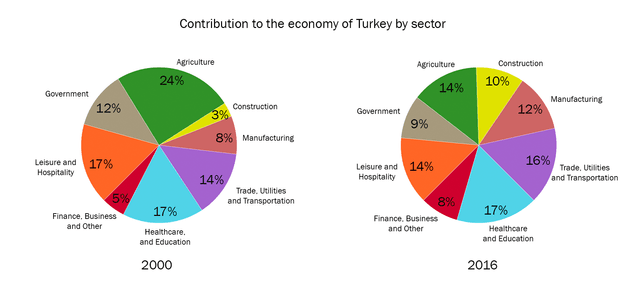
The given pie charts compare and contrast the contribution of 8 main economic sectors of Turkey’s economy in two years, 2000 and 2006. The data is calibrated in percentages.
From an
overall
perspective, it can be seen that during the period some colossal changes happened. Linking Words
For instance
, was no longer the biggest sector and it was overtaken by health and educationLinking Words
one
, which in fact, remained the same.
Getting back to details, in 2000 agriculture represented almost one-fourth of the total. And it was twice as big as the government industry. Leisure and hospitality and healthcare and education accounted for the same proportion at 17%, Correct pronoun usage
apply
while
trade, utilities and transportation were slightly smaller. The other there sector Linking Words
representedcomparatively
smaller section of the country’s economy.
In terms of 2006, healthcare and education accounted for 17% making it the biggest sector, followed by trade,utilities and transportation with just 1% lesser. Government, manufacturing and construction represented almost equal values, 9%, 12%, and 10% respectively, Correct your spelling
represented comparatively
while
leisure and hospitality both were 14%.Linking Words