
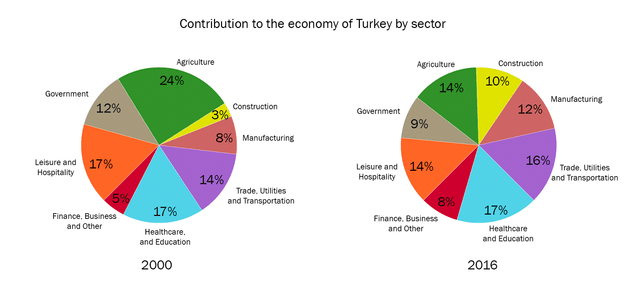
The pie charts give information about the number of endowments to industry sectors in 2000 and 2016 to the economy of Turkey.
In general, the
agriculture
sector has the biggest percentage of deposits in 2000 (24%). Use synonyms
However
, it decreased by 10% in 2016. Linking Words
Nevertheless
, the contribution of the Linking Words
agriculture
sector in 2000 overwhelmed the other sectors in 2000 and 2016.
We can see from the data that the figures for healthcare and education haven't changed for both years (17%). As can be seen, the trade, utilities and transportation segments in 2000 and Use synonyms
agriculture
in 2016 have the same amount of endowment. A modest 12% consisted of the government and manufacturing desks. Use synonyms
Finally
, a tiny minority of construction and finance, business and others contributed to the economy of Turkey (3% and 5% respectively).
In conclusion, a sizeable proportion of Linking Words
agriculture
is deposited to Turkey's economy and the smallest proportion of the construction sector.Use synonyms