
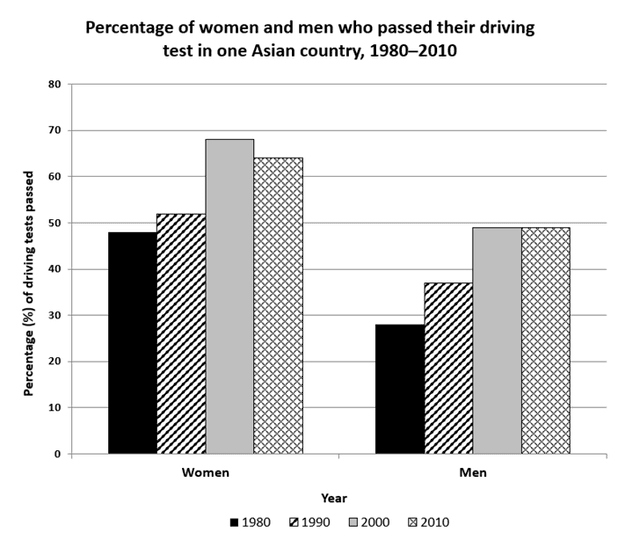
The provided graph illustrates the ratio of successful driving license tests for both genders in a particular Asian country for four years: 1980,1990,2000, and 2010.
Overall
, after an analysis of Linking Words
this
chart, it can be seen that the percentage of women who passed the driving test was the highest in all years Linking Words
compered
to men’s Correct your spelling
compared
persentage
for the same period. Correct your spelling
percentage
In addition
, the rate of passing kept increasing until 2000 for females and males.
Linking Words
To begin
with, since 1980 the ratio of women has significantly increased from 48% to 52% in 1990, and hit a peak in 2000 with around 64%, Linking Words
while
Linking Words
at the end
of the Linking Words
period
the ratio slightly decreased by approximately 3%.
Add a comma
,period
In contrast
, men’s percentage experienced dramatic growth in 1980, 1990, and 2000 by about 10% between each year to reach the highest value (59%) in 2000. After that, the rate of passing Linking Words
remainded
at the same.Correct your spelling
remained
reminded