
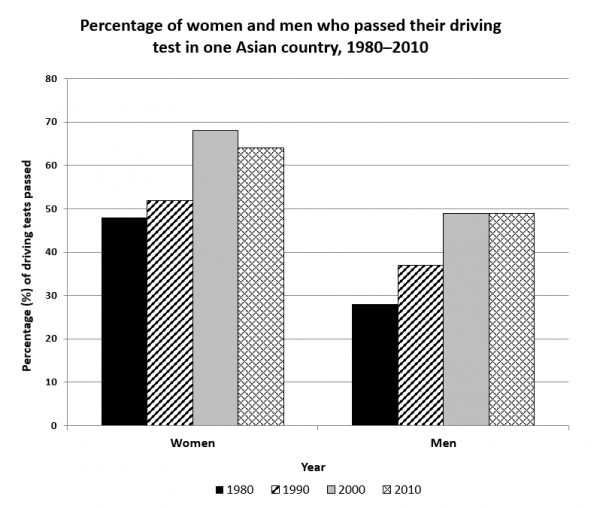
The bar graph demonstrates the proportion of individuals who successfully completed their driving tests based on gender in an Asian country from 1980 to 2010.
Overall
, the ratio of male and female drivers who passed their driving tests increased throughout the period, Linking Words
moreover
women candidates Linking Words
more
successful than men counterparts between 1980 and 2010.
In 1980, the percentage of females who passed their driving license exam was just below 50% which increased by a few percentages in 1990 before rising to around 70% and reaching a peak in 2000. After ten years it slightly reduced to nearly 65%.
Despite the fact that nearly half of their counterparts completed the license exam successfully, almost 30% of men earned their driving certificates in 1980. It increased by %10 before rising to around %50 in 2000 and 2010. The most significant disparity between them was observed in 2000 with a %20 difference in one Asian country.Add a missing verb
were more