
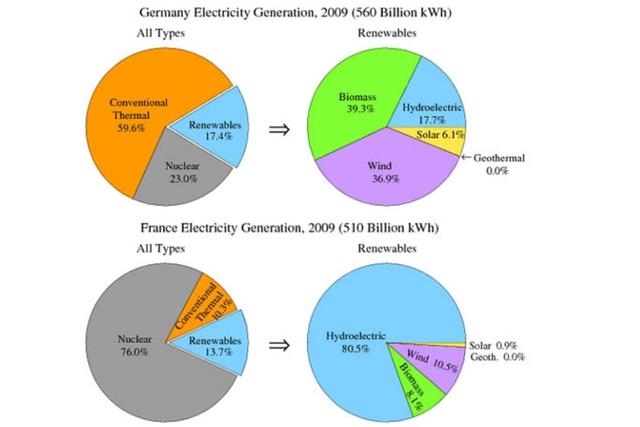
The chart depicts the generated powers in billions of two wide countries.
From an
overall
perspective, in the year 2009, the countries taken into consideration are namely France and Linking Words
Germany
. Visibly clearly, the two resources from where the electricity is coming are Renewables and All Sources.
Use synonyms
To begin
with, in the year that has been mentioned already, all type for the case of Linking Words
Germany
, reports 59.6% for conventional thermal, whilst 23% for nuclear and 17.4% for renewables. Renewables Use synonyms
instead
, illustrates Biomes 39.3%, Wind 36.8%, Hydroelectric 17.7%, Solar 6.1% and Linking Words
last
but not least, with the lowest rate of 1, Geothermal. Linking Words
On the other hand
, France shows a visibly higher fee, compared to Linking Words
Germany
, for nuclear, or rather 76%. A quite similar situation is for the case of Hydroelectric, which has a major fraction of 80.5 than other pie charts.
Use synonyms
To sum up
, with has already been analysed, it's dominant to highlight that,14 years ago, the proportions of France, reached the highest percentage, rather than Linking Words
Germany
.Use synonyms