The two graphs show the main sources of energy in the USA in the 1980s and the 1990s. Write a report for a university lecturer describing the changes which occurred.
IELTS Writing Task Chart for The two graphs show the main sources of energy in the USA in the 1980s and the 1990s. Write a report for a university lecturer describing the changes which occurred.
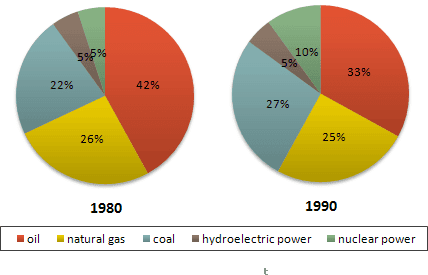
The given pies depict the ratios of the major sources of energy used by the USA in
the
Correct article usage
apply
show examples
1980 and
the
Change the article
apply
show examples
1990. Looking
mariamelina2002
Unauthorized use and/or duplication of this material without express and written permission from this site's author and/or owner is strictly prohibited. Excerpts and links may be used, provided that full and clear credit is given to Writing9 with appropriate and specific direction to the original content.
Sentences: Add more complex sentences.
▼
Linking words: Add some linking words.
▼
Linking words: Add linking words.
▼
Introduction: The introduction is missing.
▼
Introduction: The chart intro is missing.
▼
Basic structure: Write more paragraphs.
▼
Basic structure: Add more body paragraphs.
▼
Common mistake: Your writing should be 150-250 words.
Introduction: The chart intro is missing.
▼
Basic structure: Write more paragraphs.
▼
Vocabulary: Only 3 basic words for charts were used.
In this modern era, with the proliferation of technology, driverless cars are predicted to be a potential field. There are momentous reasons why it is beneficial and should be promoted among the public. In this essay, I would like to shed light on the reason and the positive developments in the upcoming paragraphs.To begin with, the advent of automatic transmissions has accelerated the development of self-driving cars. This is because automation was well adapted to the vehicle manufacturing process. As technology advances, vehicles with self-driving capabilities are expected to be able to sense their environment and operate without human involvement. In addition, albeit with limits, these types of cars are now being taken on the streets by many large companies, such as Tesla and Google, that have proved successful. As a result, this rapid progress in this field has caused a great shift in people's lives and made them think that humans will sooner no longer do the driving.Moreover, I...
Scientists perform several experiments on animals for new discoveries or to study their behaviour. While some argue that this experimentation is necessary for scientific discoveries, others believe that it should be completely banned. This essay will discuss the situations under which experiments on animals can be justified and provide alternate solutions.
In the contemporary world, the transition towards digital lifestyles has become increasingly prevalent. While this trend offers certain undeniable benefits regarding personal convenience, I contend that its long-term application presents profound risks to genuine human connections.
Some sectors of society decide to go under the knife to enhance aesthetic appeal is becoming an order of the way with some individuals. The reason why people choose this is to change their outlook. In my view, this is a negative development because it leads to many consequences for our lives.