
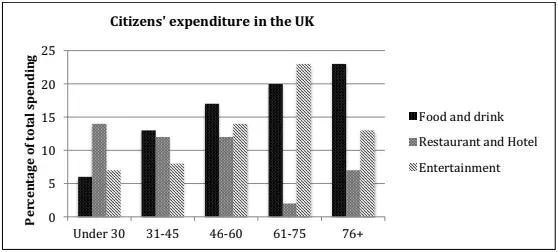
The diagram illustrates the consumption of people in the UK on food and drink, restaurant and hotel,
as well as
entertainment for various ages in the UK in 2004.
Linking Words
Overall
, it can be seen from the bar chart that the amount of public interest in food and drink went up gradually as the increases of ages, Linking Words
while
the other categories have a fluctuation trend among all life groups.
Commencing, the young crowd who have age under 30 Linking Words
years
old that spend their money on meals and beverages was at nearly 5%. It was a gradual increase in every age group and reached a plateau of around 23% for people 76 Use synonyms
years
old and above. Use synonyms
Similarly
, citizens that expenditure their money in terms of entertainment rose significantly and reached a peak in the ages group 71-75 Linking Words
years
old at 23% before dropping to just below 15% in the community 76 Use synonyms
years
old and above.
Use synonyms
On the other hand
, the total spending on restaurants and hotels has the highest value in people under 30 Linking Words
years
old accounting for 14%. Use synonyms
Subsequently
, it went down slightly in citizens in age 31-45 Linking Words
years
old and remained the same in value with the crowd around 46-60 Use synonyms
years
old at just above 10%. Use synonyms
Moreover
, it was plummet in society aged 61-75 Linking Words
years
old at just below 5% before going up in community 76 Use synonyms
years
old and above around 6%.Use synonyms