
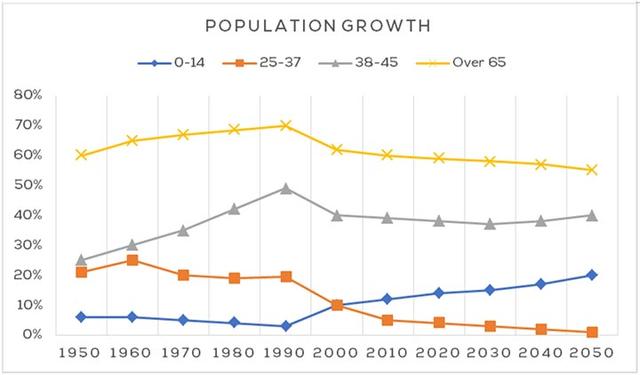
The line graph gives information about New Zealand’s people growth percentage, between 1950 and 2050. Showing
this
trend in four age segments.
Linking Words
Overall
, the segments 0-14 and 38-45 will increase by the year 2050, Linking Words
while
the age groups of 25-37 and over-65 will decline. Linking Words
Moreover
, the proportion of each group in the total population changed after the year 2000, Linking Words
however
, will remain steady until 2050.
In 1950 the highest proportion was over 65 years old, with 60%, Linking Words
this
group had moderate growth until achieve around the 70% in 1990. Linking Words
Then
, Linking Words
this
segment started to fall sightly and will remain that trend by 2050, when will be less than 60% of New Zealand’s population. Linking Words
In contrast
, the segment 0-14 had a slight decrease from around 5% in 1950 to almost 0% in 1990, when had started to rise significantly and will remain growing to achieve 20% in 2050.
Linking Words
Furthermore
, the group 25-37 had a fluctuation between 1950 and 1990, when started a decreasing trend, which will maintain until almost disappear in 2050. Linking Words
On the other hand
, the segment 39-45, had a substantial increase from 1950 to achieved a peak of around 50% in 1990. Linking Words
Then
registered a significant decrease of around 10% by the year 2000. After, had oscillated and will represent the 40% of the total population in 2050.Linking Words