
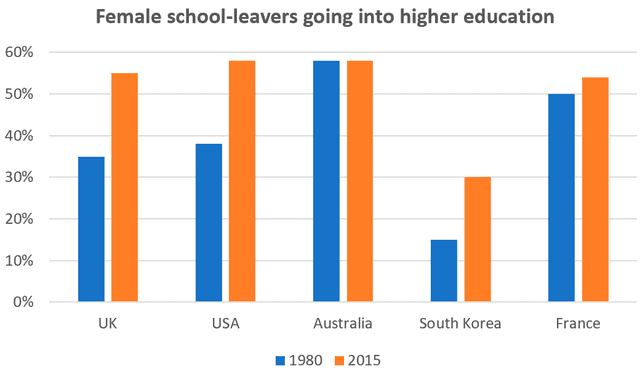
The bar chart illustrates the information about the proportion of females who go into higher education in five countries (The UK, the USA, Australia, South Korea, and France) in the years 1980 and 2015. Units are measured in percentage.
Overall
, it can be concluded from the given information that the percentage of women in higher education increased in the five countries.
Linking Words
According to
the chart, the highest proportion of Australian women going on to study after leaving school stood steady at almost 60% in two both years Linking Words
while
South Korea had the lowest of women at around 15% and 30% in 1980 and 2015, respectively.
Linking Words
In addition
, the smallest change was seen in France, where the number increased by around 5% Linking Words
while
The most dramatic change was in South Korea, where the percentage doubled from 15% to 30%. Linking Words
Moreover
, The UK and the USA increased Linking Words
similarly
by 20% over the period shownLinking Words