
The three pie charts give information about how
spend
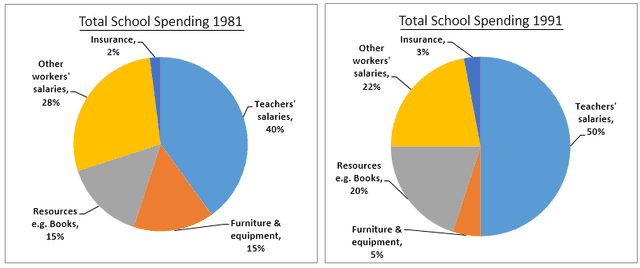
money of UK school in 3 ten-year intervals from 1981. The data is measured in proportions for 3 years.
Add the particle
to spend
Overall
, Linking Words
it is clear that
the shares of salaries of other workers, teachers and resources and furniture equipment experienced Linking Words
a
substantial growth over the period shown.
Looking at the details, there Remove the article
apply
were
a dramatic decline of other works salaries from its initial 28 % in 1981 to 15% in 2002 Change the verb form
was
while
it was 22% in 19991. The proportion of teachers’ salaries and resources, like books witnessed Linking Words
steady
rise Correct article usage
a steady
10
% and 5% between 1981 and 1991, Change preposition
of 10
while
these figures possessed 45 % and 9 % from Linking Words
its
initial 40 and 15 respectively.
The number of spending money Correct pronoun usage
their
for
insurance was 2 % Change preposition
on
1981
after decades it rocketed to 8%. There was a visible decrease of 5% of the share for furniture equipment in 1991, Change preposition
in 1981
while
Linking Words
this
figure was 15 %, 10 years before Linking Words
this
index went up over 20 %.Linking Words