
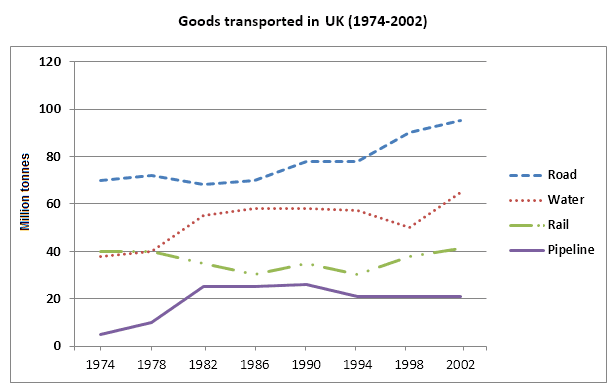
The given line graph demonstrates the tonnage of
goods
transported in the UK by different Use synonyms
transportation
modalities from 1974 to 2002. Use synonyms
Overall
, road Linking Words
transportation
had the highest amount of Use synonyms
goods
each year, and all Use synonyms
kind
of methods increased moderately Fix the agreement mistake
kinds
besides
the railway only rose slightly.
In 1974, the Linking Words
transportation
of Use synonyms
goods
on Use synonyms
road
started at 70 Correct article usage
the road
million
Use synonyms
Use synonyms
tones
, Correct your spelling
tonnes
then
fluctuated at Linking Words
this
level to 1986. Before it inclined exponentially between 1994 and 2002, it remained constant at just below 70 Linking Words
million
Use synonyms
Use synonyms
tones
in a period of 4 years. Correct your spelling
tonnes
The water
transport increased generally, except it Correct article usage
Water
was
dropped to 50 Unnecessary verb
apply
million
Use synonyms
Use synonyms
tones
in 1998. After that year it grew gradually to well over 60 Correct your spelling
tonnes
million
Use synonyms
Use synonyms
tones
.
Correct your spelling
tonnes
Railway
was Add an article
The railway
also
used for Linking Words
goods
Use synonyms
transportation
Use synonyms
,
and started at40,Remove the comma
apply
,
40 Change the punctuation
apply
million
Use synonyms
Use synonyms
tones
per year. There was a fluctuation between 1978 and 1998, Correct your spelling
tonnes
then
slowly increased and reached Linking Words
to
just over 40 Change preposition
apply
million
Use synonyms
Use synonyms
tones
. Correct your spelling
tonnes
Finally
, Linking Words
pipeline
was Add an article
the pipeline
a pipeline
other
alternative way for Change the wording
another
goods
Use synonyms
transportation
, increased to 25 Use synonyms
million
Use synonyms
tones
in 1082 and remained constant at that level, before it declined steadily to 20 Use synonyms
million
Use synonyms
tones
and not changed for Use synonyms
next
8 years.Correct article usage
the next