
The bars provide information about the proportion of different items on which families spent
with
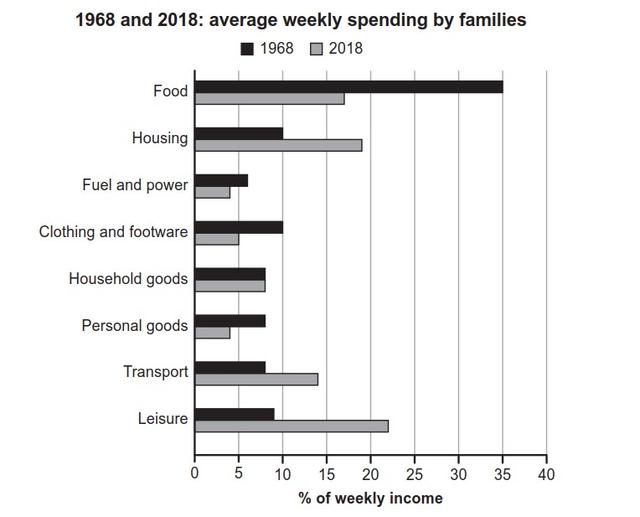
their weekly income in 1968 and in 2018.
Change preposition
apply
Overall
, it’s clear to see the ratio of food is the highest in 1968. There are three types that had a majority scale which are food, housing, and leisure. the rest of the other 4 items were not noticeable in both two years.
Specifically speaking, comparing the figure for food, the number of 1968 which was the largest ratio in 1968 about 35% was almost double that of 2008(17%). Linking Words
However
, the proportion of leisure, transport. and housing in 1968 was all less than that in 2008, almost half.
Linking Words
Last
but not least, the remaining themes were all under-represented in the over-percentage, both in 1968 and 2018. It is worth Linking Words
to mention
that was the same number for household goods in different years which was 7%.Change the verb form
mentioning