
The charts provide information about the
overall
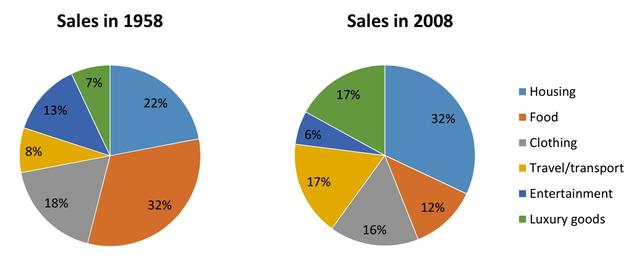
spending of people on various needs in a European country in two different years. The Linking Words
overall
expenditure on goods showed notable changes between the two periods, mainly in food, travel & transport, and luxury goods.
A number of commodities and services represented an increasing trend of spending from 1958 to 2008. The housing portion rose significantly by 10% during the time period. Meanwhile, people's purchases of luxuries and travel and transportation doubled by 2008, Linking Words
of
about 17% each.
Change preposition
by
On the other hand
, there are products for which purchasing has decreased in the target period. Food illustrated a distinct drop in the spending average, from 32% in 1958 to 12% in 2008. Clothing, Linking Words
however
, showed a slight change from 18% to 16% by the end of the period. Expenditures on entertainment Linking Words
also
presented a decreasing trend in 2008 of about half the spending of 1985.Linking Words