
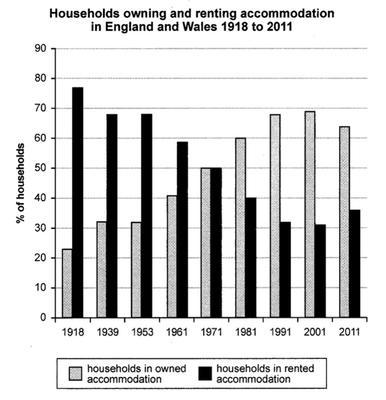
The given bar
chart
depicts the percentages of Use synonyms
households
in owned and rented Use synonyms
accommodation
in Use synonyms
England
and Use synonyms
Wales
from 1918 to 2011.
The data reveals that in 1918, there was a significant majority of Use synonyms
households
renting in Use synonyms
England
and Use synonyms
Wales
. Use synonyms
Additionally
, it is evident that nearly 25 per Linking Words
cent
of Use synonyms
households
were in owned Use synonyms
accommodation
, marking the lowest level during that year. Between 1939 and 1953, the proportion of Use synonyms
households
owning remained relatively stable, with no significant changes. Use synonyms
Furthermore
, in 1971, both household owning and renting accommodations in Linking Words
England
and Use synonyms
Wales
were evenly split at 50 per Use synonyms
cent
.
At the outset of the Use synonyms
chart
, there was a substantial 54 per Use synonyms
cent
difference between Use synonyms
households
owning and renting accommodations. Use synonyms
However
, by the end of the period, Linking Words
this
difference dramatically decreased to approximately 36 per Linking Words
cent
.
Use synonyms
Overall
, the percentage of Linking Words
households
owning Use synonyms
accommodation
experienced a substantial decline from 1918 to 2001. Use synonyms
Conversely
, the percentage of Linking Words
households
in rented Use synonyms
accommodation
significantly dropped from the beginning of the Use synonyms
chart
until 2001.
In conclusion, the bar Use synonyms
chart
illustrates the changing patterns of household ownership and renting in Use synonyms
England
and Use synonyms
Wales
over several decades. The data indicates a significant shift from renting to owning, Use synonyms
as well as
a decrease in the difference between the two categories.Linking Words
This
could be attributed to various factors Linking Words
such
as changes in the housing market, government policies, and socioeconomic shifts.Linking Words