
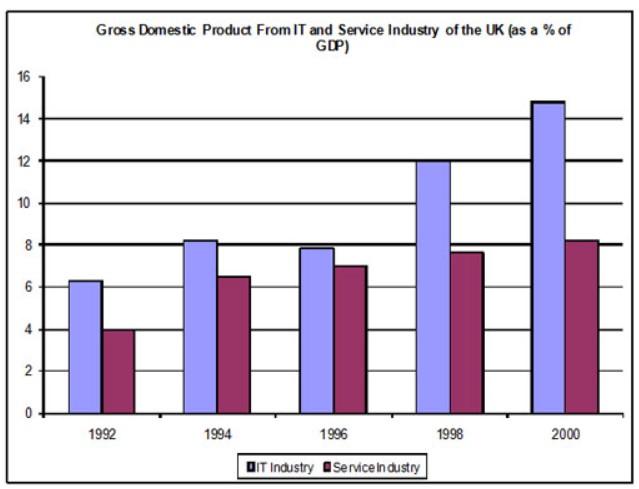
The supplied bar chart gives data on the proportion of Gross Domestic Products from the IT and
service
Use synonyms
industry
over an 8-year period (1992-2000). The data are measured in percentages. A glance at the graphs reveals that the rate of both the IT and Use synonyms
service
industries increased during the given time span. Use synonyms
However
, the IT Linking Words
industry
experienced a higher rise compared to the other Use synonyms
industry
.
As the diagram suggests, at the beginning of the period (1992), the GDP from Use synonyms
service
and IT was 4 and just over 6%, respectively. Within the time span of 2 years, both sectors uplifted a very small proportion, around 2%. Use synonyms
At the end
of the year 1996, the amount of difference in the revenue product from IT and Linking Words
service
decreased, and both got between 6% and 8%. Use synonyms
Whereas
the IT Linking Words
industry
experienced a small decline, to less than 8%, in 1996, still remained higher than the other Use synonyms
industry
by the end of the given period.
Use synonyms
In contrast
, regarding the following 4 years, it is seen that the two components experienced an upward trend to over 14% and 8% showing that the proportion of the production by the IT Linking Words
industry
was well above the Use synonyms
service
. The rate of production for the IT sectionUse synonyms
,
approximately doubled from 8% to nearly 16% in the Remove the comma
apply
last
year. Though, the Linking Words
service
Use synonyms
industry
climbed mildly to a little more than 8%, which is quite a low growth, comparatively.Use synonyms