
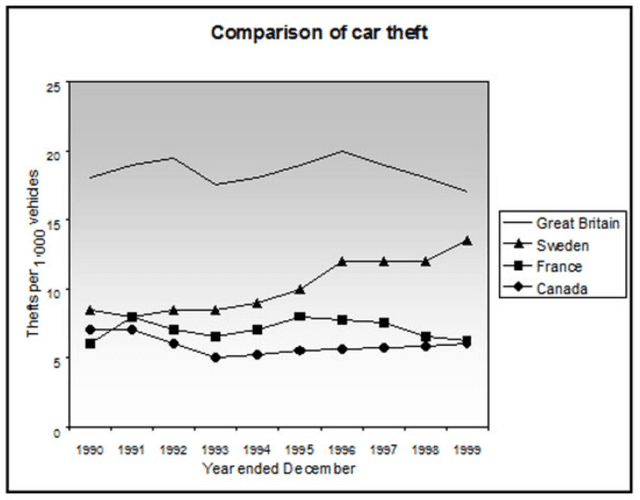
The line graph illustrates the operation of stolen
cars
for every 1000 in Canada, Great Britain, France and Sweden in nine years between 1990 to 1999.
At first glance, it is worth noticing that the theft of Use synonyms
cars
in Sweden has increased in the Use synonyms
period
given. Use synonyms
While
the number of stolen Linking Words
cars
per 1000 has collapsed in the other three countries. In the whole Use synonyms
period
frame, Great Britain was the most country that had the operations of stealing Use synonyms
cars
operations between 16 to 20 per 1000 Use synonyms
vehicles
in the whole Use synonyms
period
.
In the case of Great Britain, it rose from around 18 per 1000 stolen Use synonyms
cars
to it reached the highest point in 1992 with almost 20 per 1000. After that, it fluctuated between 17 and 20 per 1000 Use synonyms
vehicles
between 1993 to 1996 before it gradually decreased to roughly 17 per thousand Use synonyms
at the
Linking Words
end
of the Use synonyms
period
.
Regarding France, it had an oscillation trend from the beginning to the Use synonyms
end
from 6 per 1000 Use synonyms
vehicles
. For Sweden, it rose dramatically from 6 to almost 15 per 1000 thefts by the Use synonyms
end
of the Use synonyms
period
. Turning to Canada, it had a downward tendency at the start of the Use synonyms
period
from almost 7 per 1000 thefts Use synonyms
vehicles
in 1993 before it had an upward trend until it hit the same point Use synonyms
at the
Linking Words
end
of December in 1999.Use synonyms