
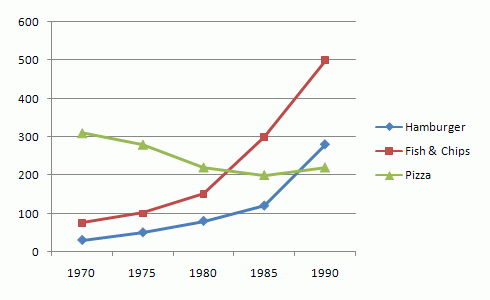
The graph gives information about the consumption of fast food (in
grams
per Use synonyms
week
), in the UK from 1970 to 1990.
The illustration presents the expenditures in fast food snacks in Use synonyms
grams
per person per Use synonyms
week
in the UK for 20 years.
From an Use synonyms
overall
perspective, it is clear to see that people chose to buy fish and chips over a period of two decades.
Between 1970 and 1980, fish and chips and hamburgers had an increase in sales Linking Words
however
Linking Words
pizza
was on a decreasing trend. The former went up from approximately 90 Use synonyms
grams
/Use synonyms
week
and rocketed to around 150 and the latter from roughly 20 Use synonyms
grams
/ Use synonyms
week
rose to around 90. Use synonyms
In contrast
, Linking Words
pizza
had a significant decline from 300 Use synonyms
grams
/Use synonyms
week
to an estimation of around 210 Use synonyms
grams
/Use synonyms
week
.
After ten years, the two trending snacks have been bought increasingly for more than three times their values in 1980; 500 Use synonyms
grams
/Use synonyms
week
and approximately 290g/wk, respectively. Use synonyms
On the other hand
, Linking Words
pizza
constantly remained at 210g/wk in 1990.
In conclusion, Use synonyms
although
there was a big rise in the consumption of Linking Words
pizza
and hamburgers, sales of fish and chips decreased.Use synonyms