
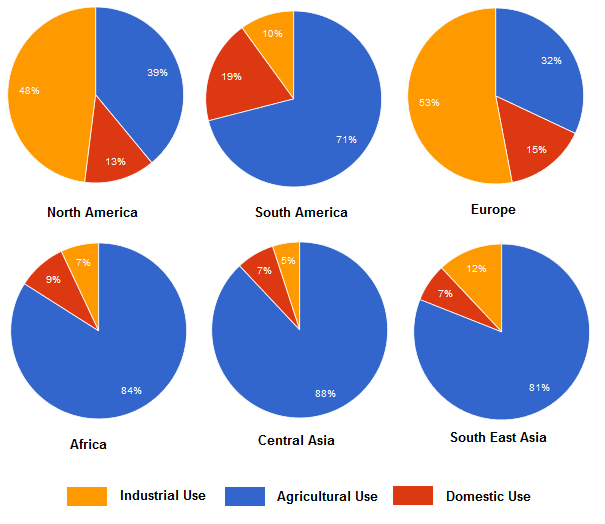
These pie charts depict 6 regions that utilized water. It is clear from the graphs Central
Asia
has the highest percentage of agricultural Use synonyms
use
.
Use synonyms
According to
what is shown the lowest percentage of domestic Linking Words
use
was in both Central Use synonyms
Asia
and South East Use synonyms
Asia
with equal rates. Use synonyms
Moreover
, domestic Linking Words
use
has the lowest percentage in all regions and the highest one was 19% in South Africa.
Use synonyms
Next,
if we noticed the industrial Linking Words
use
in both Europe and North America it has 48 and 53 per cent and that means half of the pie. Use synonyms
However
, agricultural Linking Words
use
in four regions has a rate between 71% and 88% and Use synonyms
that is
more than half.
Linking Words
To sum up
, we could say that agricultural Linking Words
use
was the highest in Africa, Central Use synonyms
Asia
, South East Use synonyms
Asia
and South America, but the lowest was in Europe and North America with 32% and 39%.Use synonyms