
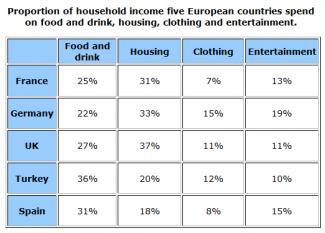
The figure displays the distribution of monthly revenue across four
categories
of expenditureUse synonyms
;
namely food and drink, housing, clothing and Punctuation problem
,
entertainment
in five European nations, measured in percentage.
Use synonyms
Overall
, the information obviously indicates that the sum of spending on food and drink and housing Linking Words
are
the largest share for all countries, accounting for approximately Correct subject-verb agreement
is
a
half of all expenses. Correct article usage
apply
While
Linking Words
people
in France, Germany and Spain prefer to spend on Use synonyms
entertainment
rather than costumes, Turkey Use synonyms
people
do the opposite. Use synonyms
However
, the consumption of both Linking Words
categories
by UK Use synonyms
people
is in the same proportion.
In terms of the main Use synonyms
paying
of Check wording
spending
people
in each country, only Turkey and Spain allocate the greatest portion of their income to food and drink, accounting for 36% and 31% respectively. Use synonyms
On the other hand
, the other countries give the first priority to Linking Words
the
housing, with France at 31%, Germany at 33% and Correct article usage
apply
UK
at 37%.
Correct article usage
the UK
In addition
, it is noticeable that the Linking Words
entertainment
Use synonyms
categories
of Germany and Spain are allocated lower than the second largest Use synonyms
categories
Use synonyms
just
Punctuation problem
, just
only
3%, Rephrase
apply
whereas
the clothing budgets are approximately Linking Words
a
half of their Correct article usage
apply
entertainment
budgets.Use synonyms