
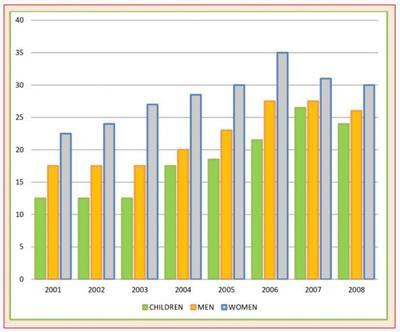
The bar chart compares
fruit
and vegetable Use synonyms
consumption
with different categories of women, men, and Use synonyms
children
in the UK between 2001 and 2008.
Use synonyms
Overall
, it is considerably seen that the five portions of nutritions eaten by women are higher during these 7 years periods, where Linking Words
children
consumed less Use synonyms
fruit
and vegetables compared to adults. In general, the number of vegetables and fruits doubled from 2001 to 2008.
To start with, the amount of Use synonyms
fruit
and vegetables eaten by adults is always higher than that of Use synonyms
children
. Use synonyms
Fruit
and vegetable Use synonyms
consumption
by both women and men was at the top in 2006 with 35% and roughly 27% respectively Use synonyms
whereas
the highest amount of nutrition eaten by Linking Words
children
reached 27% only in 2007.
Use synonyms
On the other hand
, the total amount of Linking Words
fruit
Use synonyms
consumption
slightly decreased after 2006 for adults Use synonyms
whereas
it fluctuated for kids. Linking Words
Therefore
, Linking Words
fruit
Use synonyms
consumption
was stable between 2001 and 2003 for men and Use synonyms
children
, Use synonyms
however
, started to decrease significantly after 2004 till 2008.Linking Words