
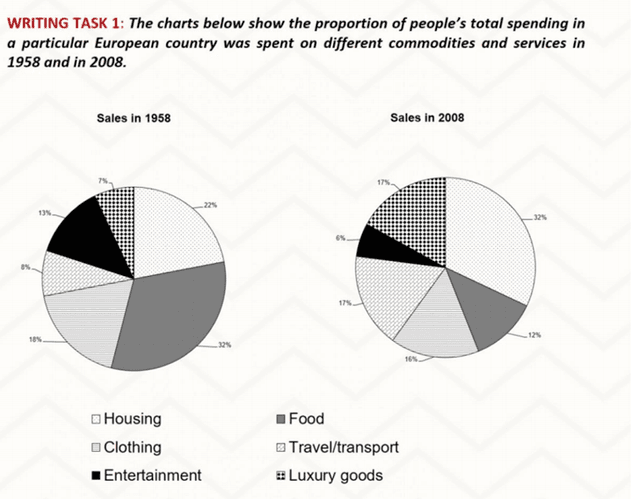
The pie charts demonstrate the total spending rate of people in six categories in a European country in 1958 and 2008. From an
overall
perspective, there was an upward trend in Housing, Travel, and Luxury goods and a downward trend in Food, Clothing, and Entertainment over the period of 50 years.
In the upward trend, Housing, which was the most expenditure, accounted for 22% in 1958. Following were Travel and Luxuries with 8 and 7% relatively. After 50 years, Housing, which rose from 22 to 32%, was still the most spent in the group meanwhile Travel and Luxury goods were the same when they both grew to 17%.
In the downward community, Food, which made up 32%, was the highest spend and followed by Clothing and Entertainment, which accounted for 18 and 13% respectively, in 1958. In 2008, Food, which decreased from 32 to 12%, had switched place with Clothing which just dropped 2%. Linking Words
Finally
, Entertainment fell just over half of it.Linking Words