
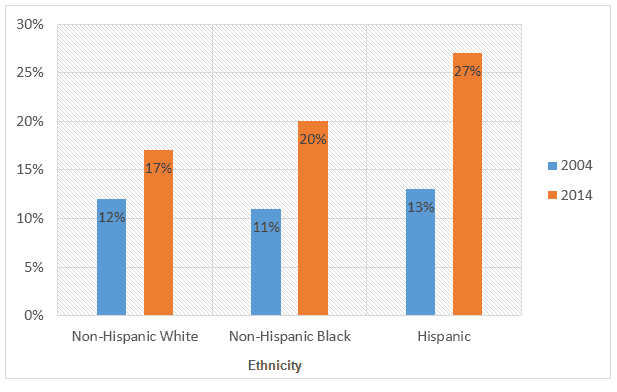
The presented diagrams convey the commonness of
obesity
among 12 to 19-year-old girls and boys with various ethnic backgrounds in the United States during the years 2004 and 2014.
Use synonyms
Overall
, it could be noticed that percentages vary dramatically among different nationalities and genders.
As can be seen in the first illustration, boys' Linking Words
obesity
rates in 2004 were less when compared to 2014. Use synonyms
For instance
, the Hispanic children's numbers show a mere 13% at first. Linking Words
However
, over a 10-year period, it soared to a whopping 27%. The latter number is approximately two-fold the initial proportion. Linking Words
Moreover
, the most underwhelming alteration of the three cultures was the Non-Hispanic Whites. Linking Words
It is clear that
only a 5% change occurred in recent times.
Linking Words
On the other hand
, the second bar chart illuminates the prevalence of Linking Words
obesity
in the female gender. Unlike the formerly mentioned figures, Non-Hispanic Black women appear to have an overwhelming chance of suffering from Use synonyms
obesity
with a major 29% currency in the year 2014.Use synonyms