
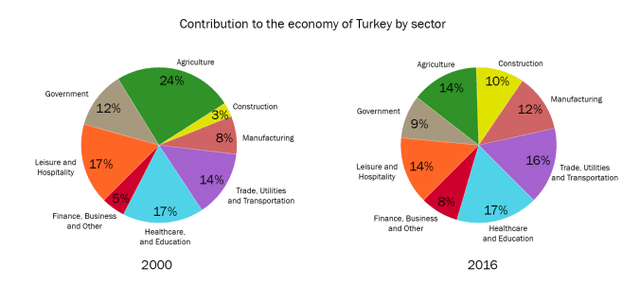
The pie chart gives information about what department contributed to the economy of Turkey from 2000 to 2016
It is clear that
there have been significantly changed in the economy of Turkey between 2000 and 2016.
In 2000. The largest pie is Agriculture, at 24%. Linking Words
By contrast
, by 2016 Linking Words
this
figure has less, with about 14%. Government and leisure and hospitality showed a high proportion in 2000, consisting of 12% and just over three quarters (17%). In 2016 these pies showed declining results, accounting for 9% and 14% respectively. In the past Finance, Business and other , construction and Manufacturing had the least percentage of the pie, at a very small number (5%) , 3% and 8%. But in 2016 . Linking Words
This
proportion is significantly higher, almost (10%), one in ten (10%) and 12% respectively.Linking Words