
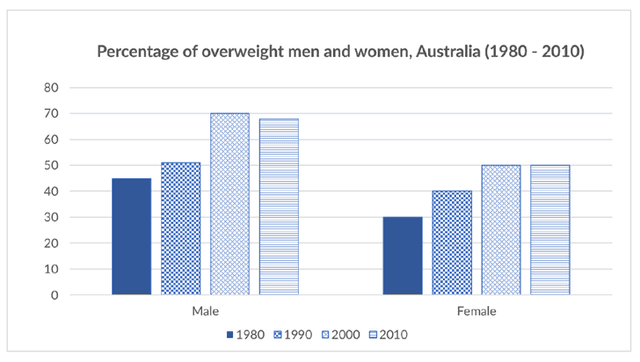
The bar chart illustrates the number of Australian people being overweight, classified by gender during the period between 1980 and 2010.
It is clear that
there were more people including both males and females who became overweight during the observed Linking Words
years
. Use synonyms
Besides
, the percentage of obese men seemed to be much higher than women throughout the Linking Words
years
.
As can be seen, in 1980, under 50% of men in Australia were overweight, compared to only 30% of women. Over the next 10 Use synonyms
years
, Use synonyms
while
the total of males climbed slightly to over 50%, female counterparts witnessed a considerable rise to 40%.
In the year 2000, there were more Australian men and women suffering from obesity. The proportion of the former rose and reached a peak of 70%,and Linking Words
then
it remained stable until 2010. Linking Words
Likewise
, the sum of the latter Linking Words
also
increased by 10% in 2000 and stayed unchanged for 10 Linking Words
years
.Use synonyms