
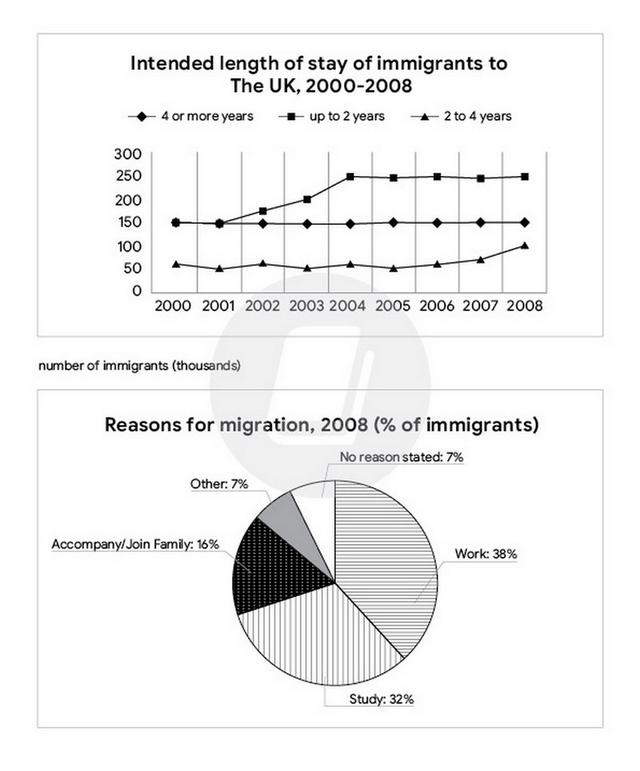
The line graph illustrates the amount of time immigrants intended to stay in the
UK
from 2000 to 2008, and the pie chart indicates the reasons for these migrations in 2008. Use synonyms
Overall
, an upward trend was seen in the number of people who planned to live in the Linking Words
UK
for up to 2 Use synonyms
years
or from 2 to 4 Use synonyms
years
, Use synonyms
while
those who stayed more than 4 Linking Words
years
remained unchanged during the period. Use synonyms
Moreover
, work and study were the two factors that caused migration in 2008.
Looking first of all at the line chart, the number of immigrants in the "up to 2 Linking Words
years
" category started at 150.000 in 2000 and witnessed no difference in the next year before increasing dramatically to 250000 people in 2004. Use synonyms
Then
Linking Words
this
figure was nearly no change over the next four Linking Words
years
. Meanwhile, individuals settled in the Use synonyms
UK
for 2 to 4 Use synonyms
years
began at around 60000 and Use synonyms
then
experienced some fluctuations between 2000 and 2006 before rising to 100000 in 2008. Linking Words
Furthermore
, immigrants tended to stay in the Linking Words
UK
in the "above 4 Use synonyms
years
" category remaining consistently at 150000 over the span of 8 Use synonyms
years
.
Turning to the pie chart, work was the dominant reason for migration, at 38%, followed by study at 32%. Use synonyms
Besides
, the motive of accompanying or joining family accounted for 16%. Linking Words
Finally
, the percentage of those who lived in the Linking Words
UK
with no reason stated or have other reasons represented 7% respectively in 2008.Use synonyms