
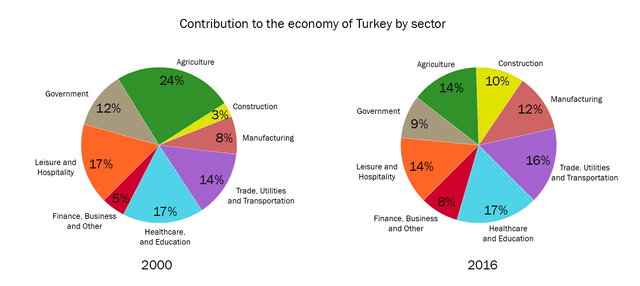
The two pie charts illustrate the proportion of different types of industry which developed Turkey's economy between 2000 and 2016.
It is clear that
there was an upward tendency in 3 of the industries in Turkey, except for agriculture, government Linking Words
together with
leisure and hospitality, which witnessed a decrease during the observed period.
As can be seen, in 2000, agriculture was recorded to be at the top of the list with nearly a quarter. Linking Words
However
, it dropped considerably to 14% in the next 6 years. Linking Words
Likewise
, the pastime and hospitality were cut slightly from 17% to 14%. It was Linking Words
also
the same for the government as it experienced a fall to 9% in 2006 after standing at 12% in 2000.
Regarding other features, Linking Words
although
construction Linking Words
along with
finance, business and other took up just a small fraction at Linking Words
first,
those climbed to 10% and 8% respectively over the following years. Linking Words
Moreover
, Linking Words
while
manufacturing Linking Words
as well as
trade, utilities and transportation Linking Words
similarly
saw a modest rise throughout the time, the figure for healthcare and education remained stable at 17%.Linking Words