
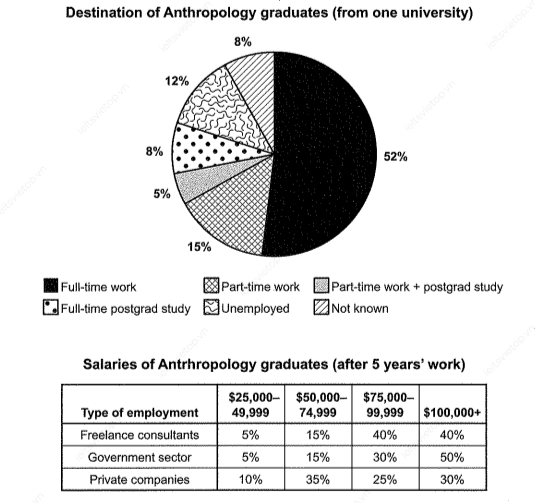
The pie chart illustrates what Anthropology degree holders from one institution did after completing their study program.
Additionally
, the table represents the earnings of the anthropologists who are working after 5 years.
Linking Words
Overall
, from the given data, Linking Words
it is clear that
the majority of the graduates opted for full-time work and the government sector provided the highest salary after 5 consecutive terms.
Linking Words
Furthermore
, the least preferable destination by the anthropologists was part-time work plus postgrad study followed by full-time postgrad study and not known which was opted for by 8% and, 15% and 12% preferred part-time work and unemployed respectively.
Linking Words
Moreover
, the private companies offered $75,000 - 99,999 to 25% of employees Linking Words
whereas
10% were earning $25,000 - 49,999. Linking Words
Also
, most of the workers got $50,000 - 74,999 in the same sector.
Freelance consultants and the government sector offered $25,000 - 49,999 to 5% and $50,000 - 74,999 to 15%. Linking Words
On the other hand
, $100,000 was given to 40% by being consultants and the government gave the same amount to 50% of their workers in anthropology.Linking Words